
12.02 Bar graphs
Are you ready?
Can you use a picture graph to answer questions?
The picture graph shows the amount of hours a student spent this month doing homework for different subjects.
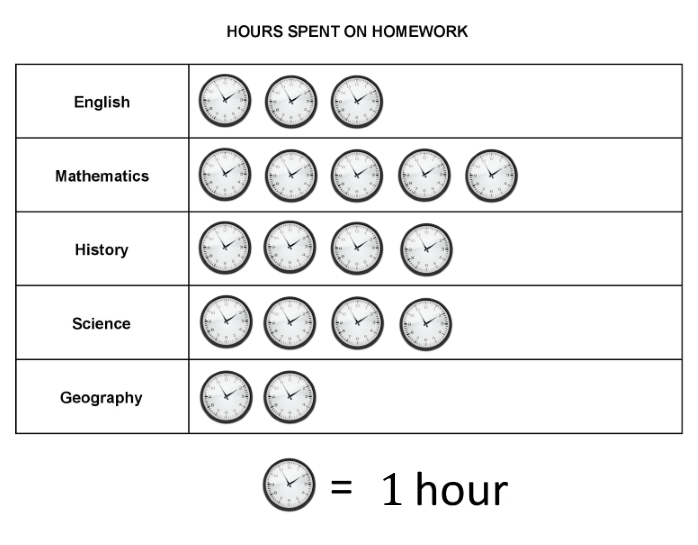
Which subject did the student do $3$3 hours of homework for?
English
AHistory
BWhich subject did the student do the most amount of homework for?
Science
AMathematics
B
Learn
This video shows shows how to construct a bar graph to display data.
Apply
Question 1
Judy is looking at the cookbooks on the shelf at her grandparent's house. She counts how many there are of each type and put the results in the following table.
| Type of Cookbook | Number of Cookbooks |
|---|---|
| Baking | $4$4 |
| Italian | $2$2 |
| Quick Meals | $3$3 |
| Gourmet | $2$2 |
Judy wants to draw a bar graph of this information.
How many bars will she need to draw?
Draw the bar graph that matches the table of information.
Learn
This video shows how to read and answer questions about a bar graph.
Apply
Question 2
Miss Brown recorded her students' favorite pets in the bar graph below.
Which type of pet is most popular?
dog
Abird
BHow many students picked a fish as their favorite pet?
- Check the scale of the graph. It may not always be $1$1.
- If there is no bar visible, it represents a value of $0$0.